AI search
The state of AI visibility, Q4 2026: what we see across 111 brands and 732,000 AI answers
Original research from 732,000 AI answers: visibility swings, model disagreement, mentions vs recommendations, and what AI cites instead of your site.
Contents
AI visibility is noisy, model-dependent and mostly earned. In a month, the median brand swings 12.5 points, and gets recommended in 0.2% of answers.
We track how AI assistants answer buyers' questions for hundreds of brands. This report pulls the most useful patterns out of one month of that data: 19 September to 18 October 2026.
Every number below is aggregated and anonymised. No brand, domain or prompt is named. Where a finding rests on a small sample, we say so.
Key findings
- Visibility moves on its own. The median brand's daily visibility moved 12.5 points between its best and worst day in one month, with no change to its prompts (111 brands).
- Assistants disagree on who wins. For 62% of brands (37 of 60), a different competitor led on different AI assistants for the same questions.
- Mentioned is not recommended. The median brand was mentioned in 19.8% of answers but recommended over alternatives in 0.2% (60 brands, 494,000 answers).
- AI rarely cites your own site. A median of 6.8% of the sources AI cited in a brand's category pointed to the brand's own domains (100 brands, 5.9 million citations).
- Competitors' sites out-cite yours. For 41 of 100 brands, AI cited competitors' websites more often than the brand's own.
- AI keeps citing the same few pages. The 10 most-cited pages on a brand's site took a median 57% of that site's citations (98 brands).
- Technical access is rarely the bottleneck. Median crawlability scored 99/100. Authority or content quality was the weakest driver for 42 of 54 brands.
- Single before-and-after checks mislead. Of 117 completed tasks measured against a control group, 29% moved up, 26% moved down and 44% stayed flat. Correlation only.
Methodology
Who. Customer brands tracked in 3RD. We excluded every internal, demo and test workspace. Of 614 customer brands, 314 had 10 or more tracked prompts and visibility data in the window. Of those, 111 had a stable daily series, which is the core sample. They belong to 51 customer organizations, in-house teams and agencies, across 80+ industries.
What. More than 18,000 tracked prompts and 732,000 AI answers from up to 11 assistants, including ChatGPT, Gemini, Perplexity, Claude, Copilot, Google AI Overviews and AI Mode. Customers choose which assistants they track, so the model mix varies by brand. For 100 of the brands we also analyzed 5.9 million source citations.
When. 19 September to 18 October 2026, unless a section says otherwise. Task outcomes cover tasks completed between February and October 2026.
How visibility is computed. For each prompt, visibility is the share of AI answers that mention the brand. The brand's score averages that across prompts. Branded prompts (those that name the brand) are excluded unless the brand chose to include them.
How "recommended" is defined. An answer counts as recommending a brand only when it recommends that brand over the alternatives. Being mentioned, or listed first, does not count. We check every non-branded answer, including questions that don't ask for a recommendation. This definition is strict on purpose, and it explains why recommendation rates are low in absolute terms.
Stable series rule. For the variance analysis, a brand needed answers on at least 25 of 30 days, at least 20 answers a day, a daily answer count within ±25% of its own median, and mean visibility of at least 1%. That keeps prompt-set changes from showing up as "swings", and drops brands that are almost never mentioned.
Deeper checks. Per-model rankings, recommendation rates and driver scores use 60 brands, capped at three per customer organization so no single agency skews the result.
Caveats that apply to every number:
- The sample leans Nordic, mostly Danish brands, plus the UK, Germany, France and others.
- Agencies run some of the brands, including some well-known brands tracked as pitches or benchmarks.
- These are observational data. Nothing here is a controlled experiment.
- We report medians across brands unless we say otherwise. Each brand counts once.
1. Visibility moves on its own
What we found. AI visibility is not a fixed number. Across 111 brands and 732,359 answers, the median brand's daily visibility moved 12.5 points between its best and worst day in the month.
|
Per brand, then median across 111 brands |
Median |
Middle half of brands |
|---|---|---|
|
Mean daily visibility |
19.6% |
8.7% – 39.6% |
|
Best day minus worst day |
12.5 pts |
7.7 – 17.4 pts |
|
Typical day-to-day move |
2.1 pts |
1.4 – 3.7 pts |
|
Largest single-day gap from the 30-day average |
7.2 pts |
4.5 – 10.4 pts |
How many brands had at least one day far from their own 30-day average:
|
A day more than… |
Brands |
Share |
|---|---|---|
|
3 points off |
99 of 111 |
89% |
|
5 points off |
77 of 111 |
69% |
|
10 points off |
30 of 111 |
27% |
Pooled across all 3,235 brand-days, 21% of single-day readings were more than 5 points away from that brand's 30-day average.
Smaller prompt sets are noisier. We split the brands into thirds by how many answers they collect a day:
|
Answers per day |
Median std dev |
Median best-to-worst range |
Median share of days >5 pts off |
|---|---|---|---|
|
24–94 |
4.5 pts |
16.7 pts |
30% |
|
101–229 |
2.5 pts |
10.3 pts |
4% |
|
230–2,501 |
2.1 pts |
8.7 pts |
4% |
Model updates add to the noise. In our own account, Gemini switched to a new model version on October 7, and 3RD marks that day on the trend line because scores before and after aren't directly comparable.
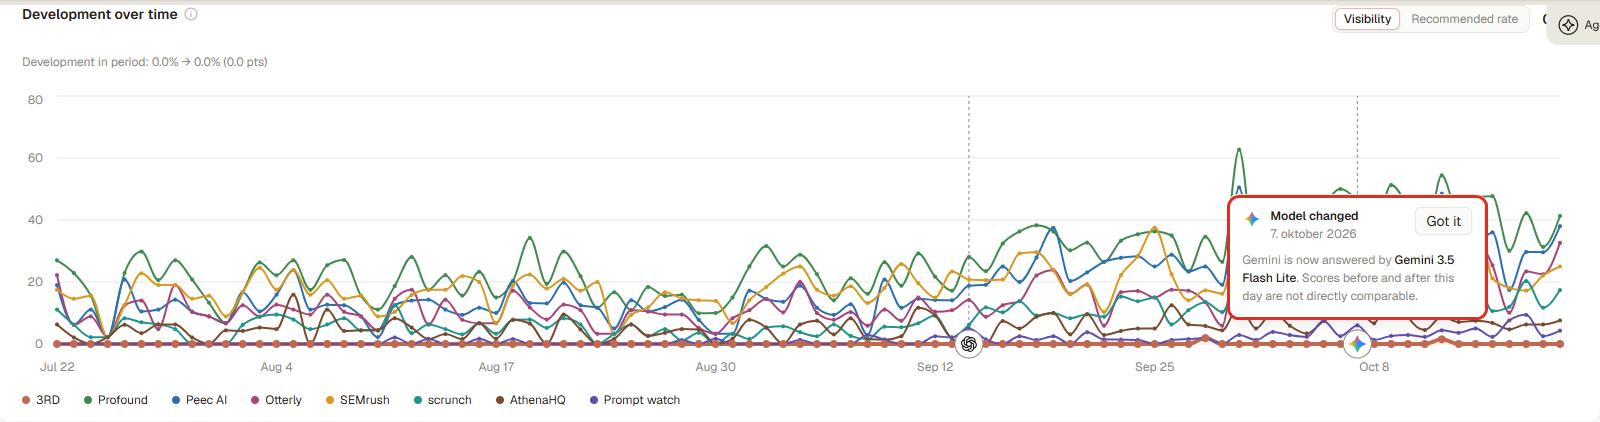
Ninety days of daily visibility in our own account. Competitor scores swing 10–20 points from day to day, and a model change on Oct 7 breaks the series.
What it means. A single check of ChatGPT tells you almost nothing. A one-week report can show a 5-point "drop" that is pure noise.
What to do.
- Judge trends on 30-day windows, not days.
- Treat moves under about 5 points as noise unless they hold for weeks.
- Track enough prompts to collect at least ~100 answers a day if you want a readable daily line.
- Log model changes next to your own changes.
How to set this up is covered in how to measure your brand's visibility.
2. Assistants disagree on who wins
What we found. For 62% of brands (37 of 60), the competitor with the highest visibility was a different brand on different assistants, for the same prompt set. The brand itself led on some assistants but not on others for 31 of 60 (52%).
Within a brand, the gap between its best and worst assistant was large:
|
n = 83 brands tracking 3+ assistants |
Value |
|---|---|
|
Median gap, best vs worst assistant |
15.7 pts |
|
Brands with a 10+ point gap |
65 of 83 (78%) |
|
Brands with a 20+ point gap |
26 of 83 (31%) |
|
Median ratio, best to worst |
2.1× |
|
Brands where the best assistant mentions them 2× as often as the worst |
45 of 83 (54%) |
Recommendation leaders also differed by assistant, for 27 of 57 brands (47%).
In this sample, Gemini was the most generous assistant for about half the brands that track it (39 of 77). ChatGPT was the least generous for 28 of 99. That describes these mostly Nordic brands and their categories. It is not a general ranking of assistants.
What it means. A blended score hides where you lose. "We rank second" can mean first on Gemini and absent on ChatGPT.
What to do.
- Track the assistants your buyers use, separately.
- Read per-model results before the blended number.
- When you compare tools, check that they report each model on its own. Our buyer's checklist covers this.
3. Mentioned is not recommended
What we found. Across 60 brands and 493,856 checked answers, the median brand was mentioned in 19.8% of answers but recommended over the alternatives in 0.2%. That is about 1 recommendation for every 65 mentions.
|
n = 60 brands |
Value |
|---|---|
|
Median visibility (mentioned) |
19.8% |
|
Median recommended rate |
0.2% |
|
Brands under 1% recommended |
44 of 60 |
|
Brands at 5% or more |
7 of 60 |
|
Brands never recommended in the month |
15 of 60 |
By prompt type, the median recommended rate was 0.3% on must-win prompts, 0.15% on core and 0% on foundational.
Remember the definition: recommending over the alternatives, checked across all non-branded answers. The absolute level is low by design. The useful comparison is against your competitors on the same prompts. The brand led its competitive set on visibility for 34 of 60 brands, on recommendations for 30, and on both for 22.
What it means. A brand can look healthy on mentions and still lose the moment a buyer asks "which one should I pick?". Being on the list is not the same as being chosen.
What to do.
- Report recommended rate next to visibility. The metrics glossary defines both.
- Look at the answers where a competitor gets recommended and you only get listed. They show which proof AI is missing about you.
4. AI rarely cites your own site
What we found. Across 100 brands and 5,926,953 citations, a median of 6.8% of the sources AI cited in a brand's category pointed to the brand's own domains. The other 93% were third-party pages.
|
n = 100 brands |
Value |
|---|---|
|
Median owned share of citations |
6.8% |
|
Middle half of brands |
3.4% – 10.1% |
|
Brands under 5% owned |
38 |
|
Brands under 10% owned |
72 |
|
Brands over 20% owned |
3 |
|
Sources cited per citing answer (median) |
8.6 |
Google's AI surfaces cited owned pages more often than chat assistants did:
|
Assistant |
Median owned share |
Brands |
|---|---|---|
|
AI Mode |
12.0% |
20 |
|
AI Overviews |
9.7% |
50 |
|
Gemini |
6.0% |
77 |
|
ChatGPT |
5.8% |
97 |
|
Perplexity |
5.5% |
47 |
|
Copilot |
4.6% |
23 |
|
Claude |
3.2% |
32 |
Model coverage differs by brand, so treat the per-assistant split as directional.
Citations include every source in every answer to a brand's tracked prompts, including answers that don't mention the brand. Social profiles and marketplace listings count as earned, not owned.
What it means. Your own website is a small slice of what AI reads about your category. Most of the evidence lives on other people's pages.
What to do.
- Fix your own key pages first, because they're the part you control.
- Then put real effort into the third-party pages AI already cites for your questions: lists, reviews, comparisons, industry sites.
- The GEO guide explains why owned and earned citations work together.
5. Competitors' sites out-cite yours
What we found. Across 100 brands, tracked competitors' websites took 8.3% of all citations, against 7.3% for the brand's own site. For 41 of 100 brands, AI cited competitors' sites more often than the brand's own.
The rest is a long tail. This classification is by domain pattern, not human review, so read it as directional:
|
Source type |
Share of all citations |
Brands where it was cited |
|---|---|---|
|
Competitors' sites |
8.3% (lower bound) |
93 |
|
Brand's own site |
7.3% |
98 |
|
Review and comparison sites |
4.9% (lower bound) |
82 |
|
Government and public bodies |
4.7% |
61 |
|
|
2.2% (lower bound) |
85 |
|
Other social and forums |
1.2% |
74 |
|
News and media |
1.0% |
61 |
|
YouTube |
0.6% |
63 |
|
Wikipedia |
0.3% |
35 |
|
Niche sites: associations, trade bodies, directories, specialist blogs, plus the unclassified long tail |
about two-thirds |
100 |
Reddit is everywhere but small. It was cited for 85 of 100 brands, but took a median of just 1.1% of a brand's citations. It was among a brand's top five earned domains for 32 of 100.
The most-cited earned domain for each brand was a review or comparison site for 22 brands, Reddit for 15, a government or health body for 11, and some other niche or third-party site for 47.
What it means. There is no single source to "win". The pages that decide AI answers are spread across many specialist sites, and your competitors' own pages are often among them.
What to do.
- Pull the list of pages AI cites for your most important questions, not for your category in general.
- Find the ones that mention competitors but not you. Those are your outreach list.
This is what that list looks like in our own account. The red boxes mark two "best tools" lists that name our competitors but not us, and one where we earned a mention:
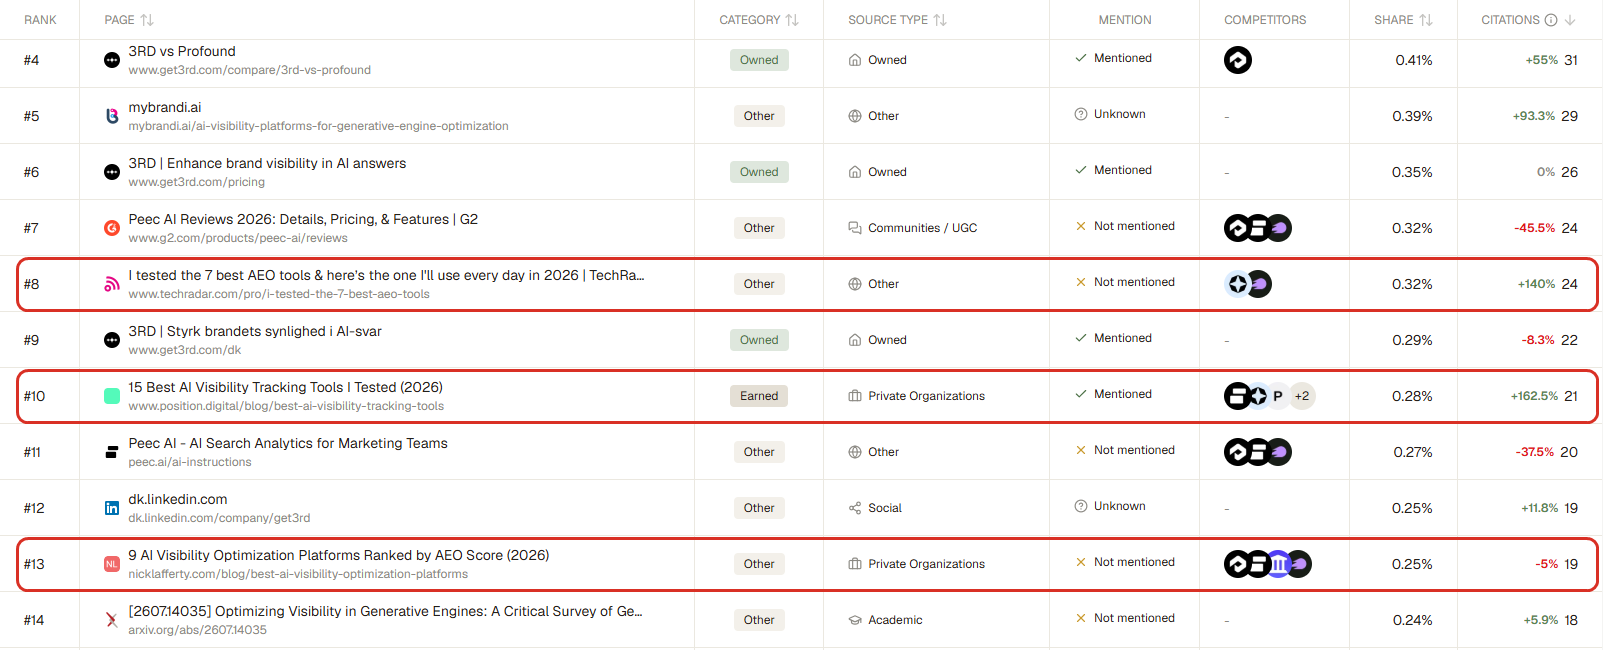
The pages AI cites for our own category. Two lists name our competitors but not us; one names us after outreach.
6. AI keeps citing the same few pages
What we found. For the median brand, the 10 most-cited pages on its own site took 57% of that site's citations, out of a median of 193 different owned pages cited at least once (98 brands, 49,114 distinct owned URLs).
|
Owned citations |
Median |
|---|---|
|
Different owned pages cited at least once |
193 |
|
Share going to the top 10 owned pages |
57% (middle half: 42% – 73%) |
|
Share going to pages first cited in the last ~90 days |
5% (59 brands) |
|
New owned pages cited for the first time per month |
about 24 (31 brands; directional) |
We can't measure how long a page takes to get cited after it's published, because no source gives reliable publish dates. "First cited" here means first cited since 3RD started tracking the brand.
What it means. AI has favorite pages on your site. New pages take time to break in, and most citations go to pages that were already cited.
What to do.
- Find your top 10 cited pages and keep them accurate, current and clearly structured.
- When you publish new pages, link them from the pages AI already cites.
7. Technical access is rarely the bottleneck
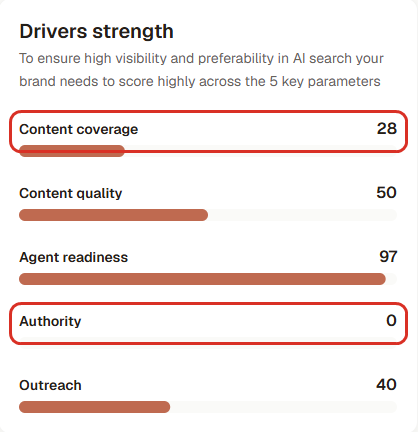
What we found. 3RD scores five drivers of AI visibility. Across 60 brands, crawlability (agent readiness) scored highest by far, and authority varied the most.
|
Driver (n = 60 brands, scores 0–100) |
Brands measured |
Median |
Middle half |
|---|---|---|---|
|
Crawlability / agent readiness |
57 |
99 |
94 – 100 |
|
Outreach |
60 |
53 |
47 – 56 |
|
Content coverage |
60 |
49.5 |
37 – 58 |
|
Content quality |
56 |
46 |
37 – 50 |
|
Authority |
58 |
43.5 |
21 – 64 |
Among the 54 brands with all five drivers measured, the weakest driver was:
|
Weakest driver |
Brands (ties split) |
|---|---|
|
Authority |
22.5 |
|
Content quality |
19.5 |
|
Content coverage |
6.5 |
|
Outreach |
5.5 |
|
Crawlability |
0 |
What the drivers measure, in short: content coverage is whether you have pages that answer the questions; content quality is how clearly and credibly they answer them; crawlability is whether AI agents can reach and read them; authority is your standing on third-party sources; outreach is the opportunity on sources that cite competitors but not you. The GEO guide explains each one.
What it means. For most brands, AI can read the site fine. What's missing is proof on other sites and pages that answer the question well.
What to do. Check access once, then spend most of the effort on authority and content quality. But do check: a score of 99 doesn't mean every subdomain is open. Our own report flagged a robots.txt that blocks agents on one of our subdomains.
8. Single before-and-after checks mislead
What we found. 3RD measures a completed task's effect by comparing the targeted prompts with a control group: the same brand's other prompts over the same windows. We looked at 117 completed tasks with a control verdict across 44 brands. The median control group was 37 prompts.
|
n = 117 tasks, completed Feb – Oct 2026 |
Tasks |
Share |
|---|---|---|
|
Moved up more than 5 points vs control |
34 |
29% |
|
Stayed within ±5 points |
52 |
44% |
|
Moved down more than 5 points vs control |
31 |
26% |
Among tasks that moved, the median move was +20.5 points up and −14 points down. The median relative change across all 117 was 0. Most were content-gap tasks (106 of 117). Outreach and rewrite tasks were too few to split.
This is correlation, not proof. Each task targets a handful of prompts, so its reading is noisy, as section 1 shows. And a task can move for reasons outside the work: competitors publish, models change.
What it means. Without a control and enough time, "it went up after we published" can't be told apart from normal variance. Half the time, the honest answer is "no clear effect yet".
What to do. Write down which prompts a change should move, compare them against untouched prompts over equal windows, and wait long enough for the assistants to re-read the page. The full method is in how to prove a GEO change moved your AI visibility.
One more pattern: must-win prompts score highest
We expected brands to be most visible on broad, educational questions. The opposite was true. Median visibility was 32.2% on must-win prompts, 24.2% on core and 12.3% on foundational (97–99 brands, about 656,000 answers). Must-win beat foundational for 83 of 96 brands.
Treat this with care. Customers define the prompt types themselves, and must-win prompts often sit closer to the brand's own product terms. It isn't a like-for-like comparison.
Our own account
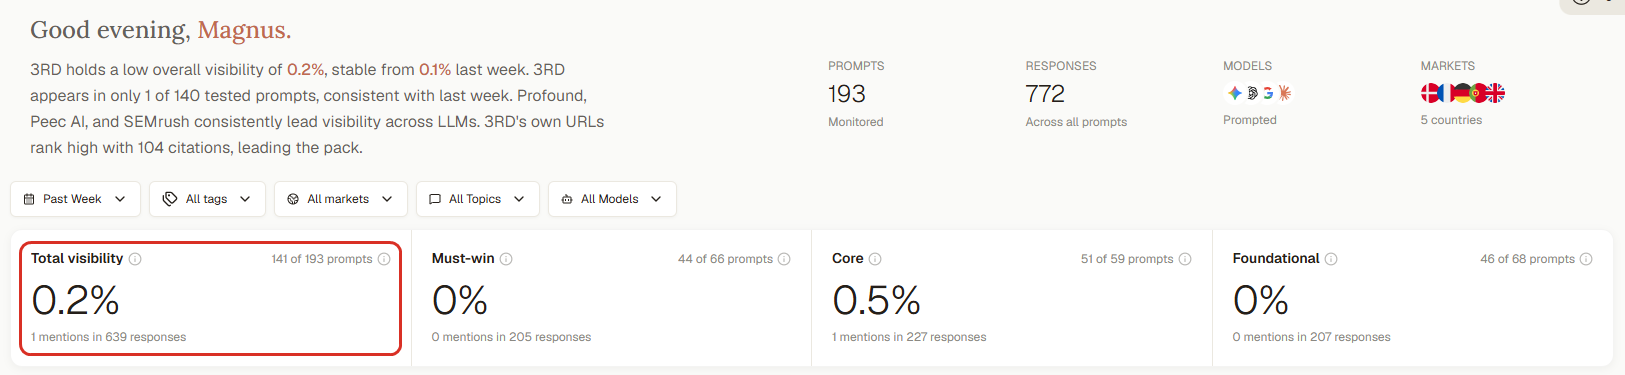
We hold ourselves to the same numbers. In the week to October 19, 2026, 3RD was mentioned in 1 of 639 answers to our own tracked buyer questions: 0.2% visibility across 193 prompts.
Our own starting point: 0.2% visibility across 193 tracked buyer questions (week to Oct 19, 2026).
Among the tools buyers compare us with, we rank ninth of fourteen. Profound, Peec AI and Otterly lead.
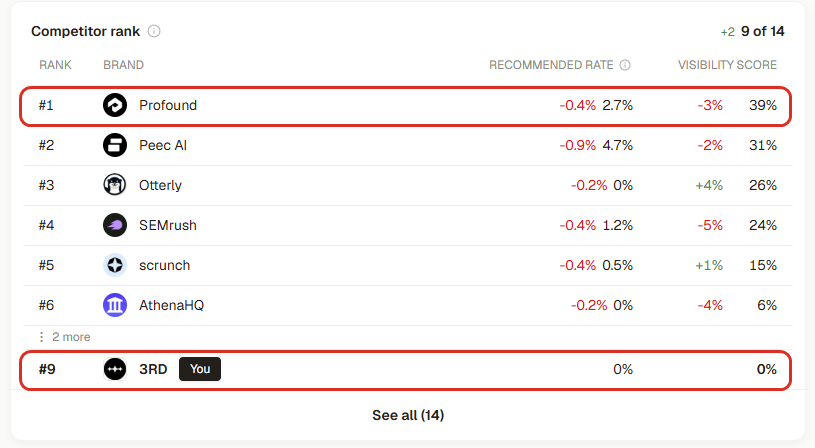
Where we stand against the tools buyers compare us with.
Our own task results follow the same pattern as the sample. After one outreach win, more AI models cite the page, but the targeted prompts moved less than our other prompts did.
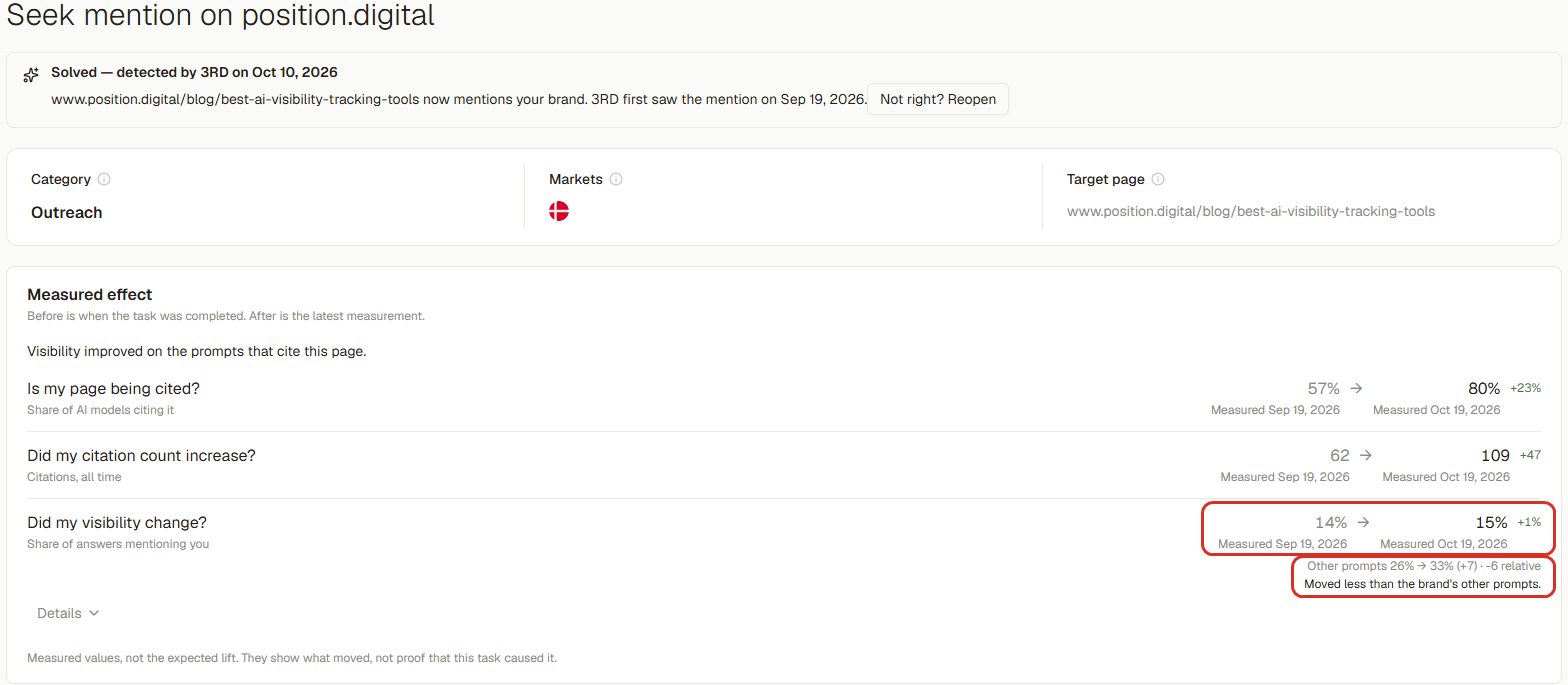
What we measured after one outreach win. The page is cited more, but visibility moved less than our other prompts. That's the honest reading.
We're publishing this research, and the guides on our blog, because 3RD Agent told us to: build the pages that answer the questions buyers ask. We'll report what happens.
How to use this data
- Benchmarks. Compare your own numbers to the medians here: visibility swing, owned share, recommended rate, driver scores. Compare against your competitors on the same prompts too, which matters more.
- Planning. Spend on the drivers that separate brands (authority, content quality), not the one that rarely holds them back (crawlability).
- Reporting. Report 30-day trends, per-model results and recommended rate, and measure changes against a control.
- Citing. You're welcome to quote any number here with a link to this page.
FAQ
How much does AI visibility change from day to day? For the median brand, the best and worst day in a month were 12.5 points apart, with no change to its prompts. 69% of brands had at least one day more than 5 points off their 30-day average (111 brands, 19 Sep – 18 Oct 2026).
How often does AI recommend a brand? Rarely, under a strict definition. The median brand was recommended over the alternatives in 0.2% of non-branded answers, while being mentioned in 19.8%. 15 of 60 brands were never recommended in the month.
What share of AI citations go to a brand's own website? A median of 6.8%, across 100 brands and 5.9 million citations. Google's AI Mode and AI Overviews cited owned pages more often (12.0% and 9.7%) than ChatGPT (5.8%) or Claude (3.2%).
Does Reddit dominate AI citations? No. Reddit was cited for 85 of 100 brands, but it took a median of only 1.1% of a brand's citations. Most citations went to a long tail of niche and specialist sites.
Is this data representative of all brands? No. It comes from brands tracked in 3RD, which lean Nordic, and some are tracked by agencies. Use it as a benchmark for patterns, not as a census. All of it is observational.
Cite as: 3RD, State of AI visibility Q4 2026, get3rd.com.